Why Enterprise Architecture 4.0 combined with Kineviz GraphXR + System Logs are a Leap Forward
We are experiencing a paradigm shift that aligns Enterprise Architecture with the needs of digital and AI enabled organisations. That alignment is achieved through Enterprise Architecture 4.0 and the use of Graph technologies. In an increasingly digital business, Enterprise Architecture practices needs to be about more than abstract models showing coloured boxes and lines. It is about businesses being able to see and understand the organisation as a living, active network of people, processes, systems, relationships, governance and data.
Combining GraphXR with Enterprise Architecture 4.0 enables architects to move from hierarchical or abstract type views to a more connected, interactive, connected and transactional representation of the organisation. There are several practical and economic reasons why this combination works. We can derive deep insights into how processes are actually executed, as opposed to how they are thought to work based on process models. Variations and deviations can be quickly determined, as can non-optimal workflow paths. Actual activity times can be analysed to improve productivity, time to complete and operational cost.
Enterprise Architecture 4.0 embraces all things digital and provides a framework for Artificial Intelligence, Living Architecture Models, and Digital Twin. The strengths of GraphXR means it can process and analyse large volumes of complex data, visualising the data and mirroring how complex systems actually behave. This enables the user to see operational patterns, anomalies, and key connections in context.
GraphXR is a powerful data analytics and visualisation platform and for this case study we analysed and visualised XES (eXtensible Event Stream) Event Logs, created by most enterprise resource planning systems (ERP) to expose how systems are used within the organisation. An XES file is a structured event log that uses an XML format to store events. The non-linear, dynamic and deeply intertwined world of the businesses data comes to life once analysed and visualised.
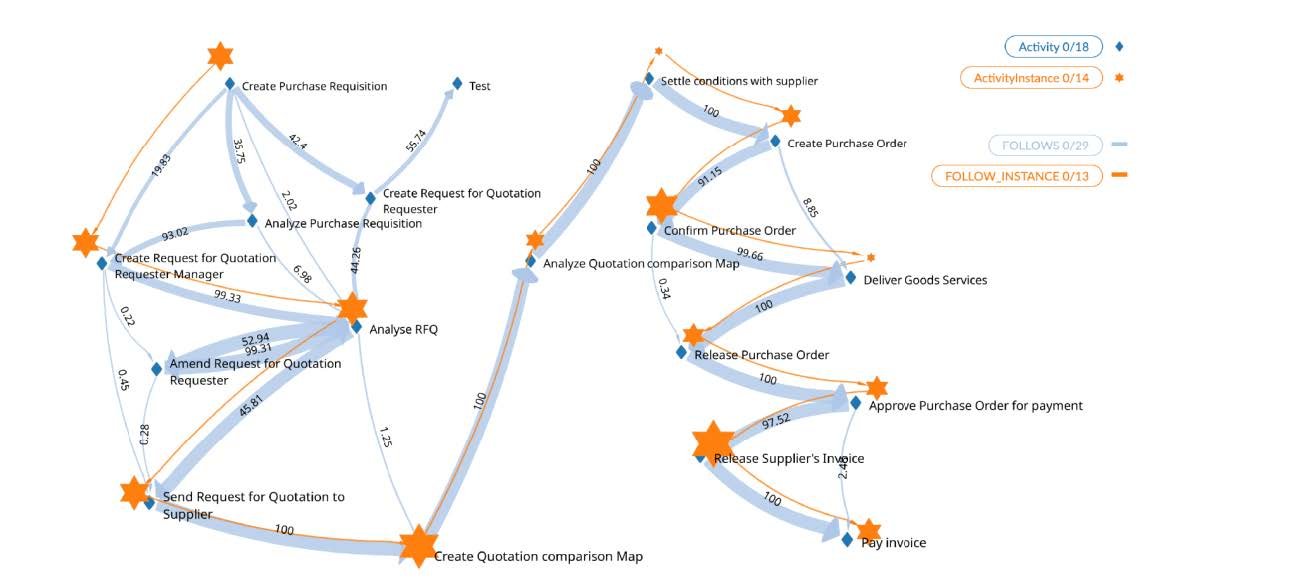
In the following example the source data was an XES file from an Enterprise Resource Planning System (ERP). From the file content we were able to discover the process flow from 900 cases and 22,000 records. A case is represented in the graph as a workflow path. Each Node within the graph depicts an activity or event and the Edge (the link between Nodes) shows the transition or sequence. The benefit of using GraphXR over more traditional process mining tools is it clearly shows the extent of the relational complexity and has the added benefit of bringing together structured and potentially additional unstructured data into the analysis, something typical process-mining applications don’t offer.

This image deficts the flow of transactions through the organisations financial system (ERP) with thicker lines showing higher volumes
In this example we can see the process flow and the transactional volume, who/what triggered it, which system logged it, and precise timestamps for each transaction. Specific transaction paths can also be quickly ascertained. This means that transactions anchor the architecture to reality by turning processes into multi-layered knowledge graphs for rapid understanding and insights, addressing the many common why, what, and how, type questions.

Here we can drill into the detail to explore the statistical analysis
Whilst we can analyse the actual process steps, quantification, and duration for the completion of a particular activity, we also have the ability to drill deeper into the data and analyse transactions to look for regular patterns and allowing us to compare multiple datasets if needed. The size of the node indicates the duration for the completion of the particular activity compared to the average, which means variation and deviation becomes clearer.
We can start to overlay specific transactions to see the route taken and delays that occurred (bigger stars)
By analysing the journey of particular activities, we are able to identify aspects of the actual transactions such as volume, mean pathways, transaction progression and cohort analysis. With Activity edges in place the shortest path and most used path was easily identified. Using data from the event log, the statistical distribution of steps, total time taken, and actual task completion time can be determined. The analysis showed that certain cases took 37 steps and over 200 days to finish, but the actual processing time required is only 2 days. This highlights potential issues with process inefficiencies, delays or constraints, and or non-value add activities. Through powerful query techniques we can start to ask questions like “Which process variants led to delays of over 5 days?” or “Cluster all cases where the process failed compliance rules.”

Overlaying multiple transactions to better understand variations in processing
When data is visualised in this way Enterprise Architects and leadership teams are able to optimise business processes and data flows and tune capacity where traffic is heavy, or business critical activities exist. Once identified legacy hops that add time or risk without value can be considered for removal. Any detection of sudden spikes on a least travelled edge may also provide indicators where further investigation is needed. GraphXR can help refine the design by blending both entity-centric and event-centric activity models.
There are numerous optimisation and innovation benefits gained from analysing and visualising structured and unstructured process and transactional data.
CIO’s/CTO’s can tie systems activity to real transaction volumes.
Operations teams have visibility of actual data and processing loads which can be used for planning and resource allocation.
Vulnerability and risk detection becomes clearer.
Inefficiencies can be identified and can be flagged for further analysis.
Automation opportunities can be explored.
Process optimisation and innovation can be driven and monitored.
Activity, Product and Decision Governance positions can be easily determined.
These tools and approaches enable organisations to not only document and understand the complexity levels in play but to actively position the organisation for greater resilience, sustainability, and value. It’s about uncovering, analysing, and understanding the actual paths data, systems, processes and people take.
By combining Enterprise Architecture 4.0 practices with GraphXR log file analysis and data visualisation, we gain not only clarity but the fact-based evidence and confidence to design, build and act.